PROFIT = TOTAL REVENUE - TOTAL COSTS
Total Revenue = Price * Quantity sold
--> Perfect Competition --> price given (set) between demand and supply in the market.
Total Costs --> economic cost
EXAMPLE
Sandwich Production
- Factors of Production
--> Labor-
- # of employees (variable input)
- They change according to production/output scale (large or small)
EX. Dairy Farm (variable input)
- # of people that work on the farm
- Amount (content) of feed for cows
- Medicine for cows
| # of Employees (labor) | Total Production (TP) | Average Product (AP) | Marginal Product (MP) |
| 0 | 0 | - | - |
| 1 | 10 | 10/1 = 10 | 10/1 = 10 |
| 2 | 25 | 25/2 = 12.5 | 15/1 = 15 |
| 3 | 35 | 35/3 = 11.7 | 10/1 = 10 |
| 4 | 40 | 40/4 = 10 | 5/1 = 5 |
| 5 | 42 | 42/5 = 8.4 | 2/1 = 2 |
| 6 | 42 | 42/6 = 7 | 0/1 = 0 |
| 7 | 39 | 39/7 = 5.6 | -3/1 = -3 |
AVERAGE PRODUCT (AP) = TOTAL PRODUCTION (TP) / VARIABLE INPUT
MARGINAL PRODUCT (MP) = CHANGE IN TOTAL PRODUCTION (TP) / CHANGE IN VARIABLE INPUT USE
--> (in this example it is a 1 unit change, in HW 6 it is a 10 unit change)

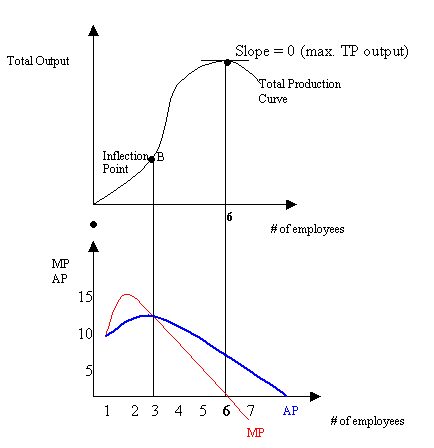
GRAPHS: (TP, MP, AP)
-The TP curve at B (inflection point) shows where the slope shifts.
-Before B, --> TP has a slope increasing at an increasing rate.
-After B, --> TP has a slope increasing at a decreasing rate.
-When employee number = 6, slope = 0 (MP = 0)
-The TP curve also shows the efficiency of using more employees, the 6th employee is not doing anything for the business, not helping or hurting, the 7th employee is not needed and is hurting the business.
Law of Diminishing Returns:
Def.- When additional units of a variable input are added to fixed inputs after a certain point,
the marginal product of the variable input declines. --> When you started slowing down reaching the point when you are done
Law of Diminishing Marginal Product
- When the MP curve declines after a certain point.
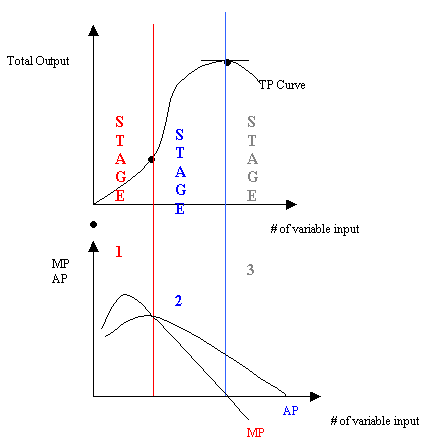
3 Stages of Production
