MID TERM 2 NOVEMBER 8, THURSDAY
Total Product (TP)
--> The total output levels using both fixed inputs and variable inputs
-Fixed Inputs--> EX. land, it is always there, you cannot get rid of it easily. Other examples are machinery and buildings.
-Variable Inputs--> Changes with output level --> EX. fertilizer, electricity, irrocation, the more of any of these
produces more and changes the variable.
Average Product (AP) or Average Physical Product (APP)
Total Product / Variable Input Use
Marginal Product (MP)
Change in Total Product / Change in Variable Input Use
NOTE: in HW6 it is a 10 unit change

The 2 Graphs:
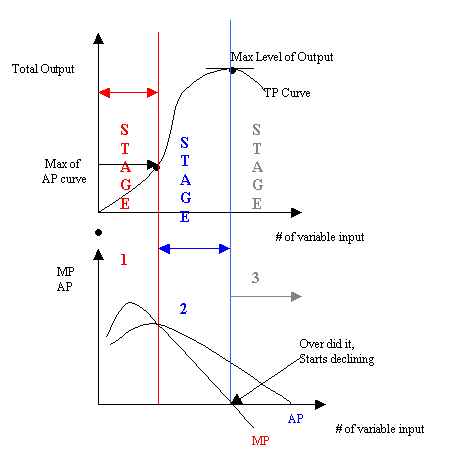
--> Combine 3 different concepts to show different stages of productivity.
--> As long as MP is higher than AP, you are not going to stop prodcution.
--> Stage I is everything before MP and AP cross.
--> Stage II is from where MP and AP cross to where the slope of TP curve = 0 and MP is at 0
--> Stage III is everything beyond where the TP curve slope = 0 and MP is at 0
NOTE:*FOR EXAM KNOW HOW TO IDENTIFY STAGES*
Stage I
--> MP > AP , keep using more variable input, keep producing more, no reason to stop production yet.
Stage II
--> MP < AP , but MP > 0 , not that bas yet, there is a slow down and a trade off decision:
1.) Use more variable input --> expect total output level to increase but slower.
OR
2.) Reduce variable input use --> total input decreases
Stage III
--> MP = 0 , used too much variable input, total output can only decrease.
Production Process *(time frame)*
Short-run--> With fixed input you cannot change the usage easily
EX: A tractor engine, it lasts for 20 - 30 years, in 20 years you can get rid of it. OR.. A barn, you can build
it then tear it down in 5 years.
Long-run--> No fixed input, all variable inputs, no constraint for farmer or producers, you can
get rid of anything and get new things.
*SHORT-RUN AND LONG-RUN DIFFER FROM CASE TO CASE.*
NOTE: there is no specific time period to define short-run and long-run.
CASE I: SHORT-RUN PRODUCTION PROCESS
Assume:- Fixed inputs, can not exit or enter the industry easily, perfect competition (prices are set) in both
input markets and output markets.
EXAMPLE: Seitz p. 80
Corn Produciton
-Output = Corn (bushels)
-Fixed Input = Land (acres)
--> Rent = $2 / acre
-Variable Input (only 1) = Fertilizer (lbs)
--> Fertilizer Price = $25 / lb
NOTE:
1 Bushel = 40 lbs
55 gallons = 1 barrel (oil)
100 lbs = 1 c.w.t (milk weight)


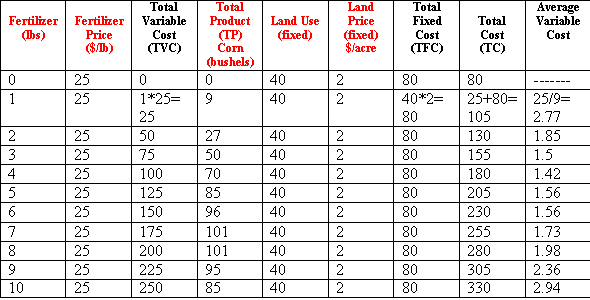
*The red columns are given, the others have to be figured out with the the given information.
TOTAL VARIABLE COST (TVC) = FERTILIZER PRICE * FERTILIZER LBS
TOTAL FIXED COST (TFC) = FIXED INPUT * FIXED PRICE (land)
TOTAL COST (TC) = TOTAL VARIABLE COST (TVC) + TOTAL FIXED COST (TFC)
AVERAGE VARIABLE COST = TOTAL VARIABLE COST (TVC) / TOTAL PRODUCT (TP)
AVERAGE FIXED COST (AFC) = TOTAL FIXED COST (TFC) / TOTAL PRODUCT (TP)
AVERAGE TOTAL COST (ATC) = TOTAL COST (TC) / TOTAL PRODUCT (TP) OR AVERAGE VARIABLE COST (AVC) + AVERAGE FIXED COST (AFC)
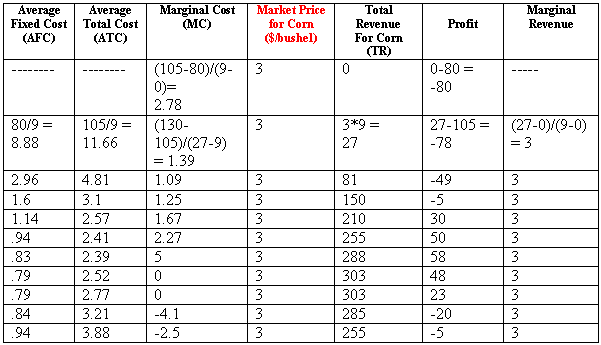
MARGINAL COST (MC) = CHANGE IN TOTAL COST (TC) / CHANGE IN TOTAL PRODUCT (TP)
TOTAL REVENUE (TR) = OUTPUT PRICE * TOTAL PRODUCT (TP)
PROFIT = TOTAL REVENUE (TR) - TOTAL COST (TC)
MARGINAL REVENUE = CHANGE IN TOTAL REVENUE (TR) / CHANGE IN TOTAL PRODUCT (TP)
--> In this example *Marginal Revenue = Market Price* for corn, this is ONLY true in a perfect competition market
Profit--> Started low then starts to rise up to $58, then declines.
--> Total Product = 96 bushels for highest profit level using this chart.
--> Also, to find profit max. look at MC and MR, when MC=MR that is when profit is the highest.
Decision for this Farmer: (short-run)
*MC = MR = Market Price for Product* is an ECONOMIC CONDITION, with the ASSUMPTION: perfect competition, and all other things (substitutes and complements) are equal.
GRAPH FOR SHORT-RUN DECISION

Graph:
--> ATC - AVC = AFC
--> Total Cost (TC) for P1 = everything under where Profit Max. Output 1 intersects ATC
--> Total Revenue (TR) is bigger because it includes the price line.
--> The little box on top is Profit (TR-TC).